
Measuring the Real-World Value of Service Design
Service design is how you orchestrate people, processes, and technology across a customer’s entire experience to make it feel seamless. But when you need to justify a budget, get the team to agree, or improve a new service, design alone isn’t enough. You need data.
The main challenge for any service design team is turning "good design" into measurable business results. Without clear metrics, even the best strategies can fail to show a real impact. This guide covers the key performance indicators (KPIs) you need to track to prove service design ROI and help your work lead to lasting growth.
Why Measurement Matters for Service Design ROI
The purpose of tracking service design success is to connect intangible design improvements to solid business value. Service design projects are often complex and cross-functional, {making} them hard to measure. By establishing clear metrics, you can:
- Justify investment and prove that redesigning a process or touchpoint leads to more revenue or lower costs.
- Get stakeholder buy-in by presenting a clear, evidence-based case for future investment and resources.
- Prioritize improvements and go beyond gut feelings to find the specific friction points in the service blueprint that need attention now.
Four Areas to Measure for Service Design ROI
Good measurement has to cover both sides of service delivery: the customer-facing experience (frontstage) and the internal operations that support it (backstage).
1. Measuring the Experience with CSAT
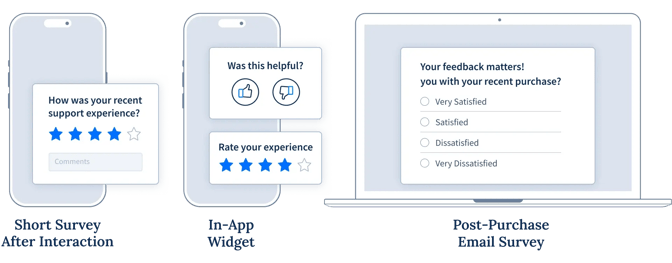
Customer satisfaction scores (CSAT) directly measure how satisfied a customer is with a specific interaction or touchpoint. They give you immediate, useful feedback about a recent experience (like after a call, purchase, or delivery) and are vital for finding high-friction spots in your service path.
How to Track CSAT
To track customer satisfaction, use transactional surveys. Send a short, one-question survey immediately after a specific interaction, such as after a support call, a product delivery, or an in-store visit. The key is to keep it simple. Ask a direct question like, “How satisfied were you with your recent purchase?” and provide a simple scale for the response, such as 1-5 or a range from "Very Unsatisfied" to "Very Satisfied." You'll get immediate and specific feedback on key touchpoints.
Triggered Surveys Micro-Feedback
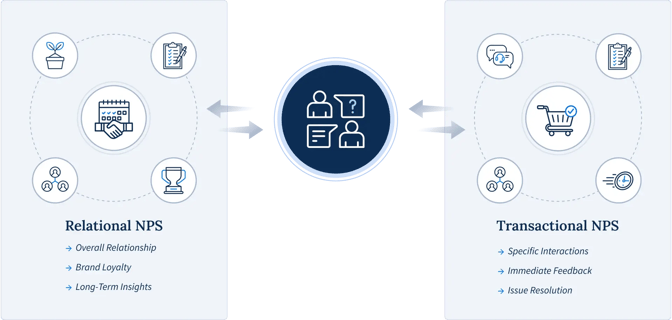
2. Gauging Loyalty and Advocacy with Net Promoter Scores (NPS)
NPS measures customer loyalty and how willing they are to recommend your service, based on one question ("How likely are you to recommend our company/service to a friend or colleague?").
To calculate your Net Promoter Score, you first ask customers how likely they are to recommend your service on a scale of 0 to 10. Based on their answers, you group them into three categories. "Promoters" are those who give a score of 9 or 10 and are considered loyal enthusiasts. "Passives" score a 7 or 8 and are satisfied but not loyal enough to promote the brand. "Detractors" are those who score between 0 and 6. They are unhappy customers who can damage your brand's reputation. To get your final NPS score, you subtract the percentage of Detractors from the percentage of Promoters. The final score is a clear measure of overall customer loyalty.
A high NPS often signals better customer retention and a higher lifetime customer value (LTV), and is a valuable long-term service design KPI.
Context and Caution
While NPS provides a valuable score, it doesn't tell you the story behind the number. Metrics like NPS and CSAT tell you what is happening, but they don't explain why it's happening. To truly understand the customer experience, you must pair your quantitative data with qualitative feedback. Follow up with customers to ask open-ended questions, conduct user interviews, and analyze comments from surveys. Here you'll find the specific problems and opportunities you need to address to improve your service design.
The Importance of Qualitative Data in Service Design
3. Tracking Cost and Time with Operational Efficiency Metrics
Metrics focused on reducing the time, cost, and effort required by your organization to deliver the service. These are crucial for demonstrating the economic value of service design.
Service design is as much about improving the employee experience and internal processes as it is about the customer. Streamlined internal workflows directly reduce overhead.
Examples
- Time to resolution (TTR) measures the average time it takes for an employee or system to resolve a customer issue from start to finish. A lower TTR often means less employee effort and higher customer satisfaction.
- Cost per interaction is the total cost, including employee time and system usage, associated with a single customer interaction like a support call. Service design aims to lower this by providing more self-service options or making agent-assisted interactions more efficient.
- Employee time on task tracks how long it takes an employee to complete a specific internal task required to deliver the service, such as processing a form or verifying information. Reducing this time frees up employees for higher-value activities.
Cost Per Service Interaction: $15
First Contact Resolution (FCR)
Time to Resolution (TTR)
4. Aligning Internal Service with Employee Engagement Surveys
Measuring how motivated, satisfied, and aligned internal teams are with the service delivery goals.
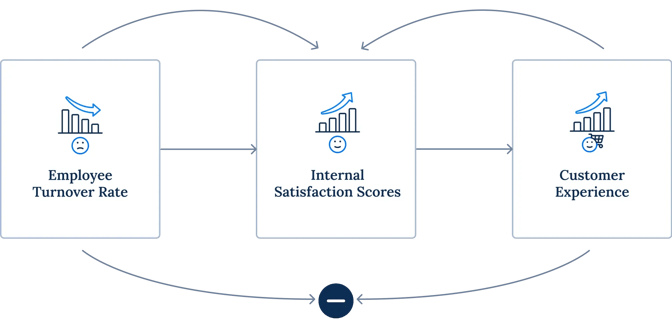
This tracks the "backstage" impact. Poor employee experience (EX) leads to poor customer experience (CX), a concept known as the service-profit chain.
Relationship to CX
There's a direct connection between how you treat your employees and how they treat your customers. The service-profit chain shows that high-quality internal support (good tools, clear processes, and a positive work environment) leads to higher employee satisfaction. Satisfied employees are more loyal and productive, which enables them to deliver better value and service to customers. This improved service directly increases customer satisfaction and loyalty, which in turn drives revenue growth and profitability. Investing in the employee experience is a direct investment in the customer experience and the company's bottom line.
Beyond the main four
While these metrics cover the basics, more advanced teams use specialized metrics tied to specific user actions.
Metric |
What It Measures |
Service Design Goal |
|
Task success rate |
The percentage of users who finish a specific task (e.g., submitting a claim, scheduling an appointment). |
Reducing friction at key touchpoints. |
|
Abandonment rate |
The percentage of users who start a process (e.g., online enrollment) but leave before finishing. |
Simplifying processes and improving clarity. |
|
System adoption rate |
How many employees or customers use a new digital tool introduced as part of the service. |
Effective tools and training. |
Putting Service Design Measurement into Practice
To get real value from your service design ROI, you have to build measurement into your process from the start, not just check it at the end.
Mapping Metrics to Service Blueprints
Your service blueprint should be the main tool for measurement. Every customer action (frontstage) and every internal action supporting it (backstage) should have a metric assigned to it.
- Identify touchpoints by finding every point of interaction (e.g., "customer gets confirmation email," "agent verifies ID").
- Assign metrics like CSAT/NPS for customer-facing steps and operational efficiency KPIs (TTR, cost) for internal steps .
- Create baselines before making any design changes.
Establishing a Baseline
You can’t prove success if you don’t know where you started. Always use the discovery phase of a project to document the current metrics. When the new service launches, the difference between the new numbers and the old baseline shows the direct business value your service design work delivered.
Takeaway
The best businesses go beyond designing great services to measuring, adapting, and evolving them. By actively tracking a balanced set of service design metrics covering both customer experience and internal operations, you can stop justifying your design work and start showing its clear, long-term business impact.
-2.png)
-2.webp)