Share this
by Seven Peaks on Aug 15, 2023 4:34:31 PM

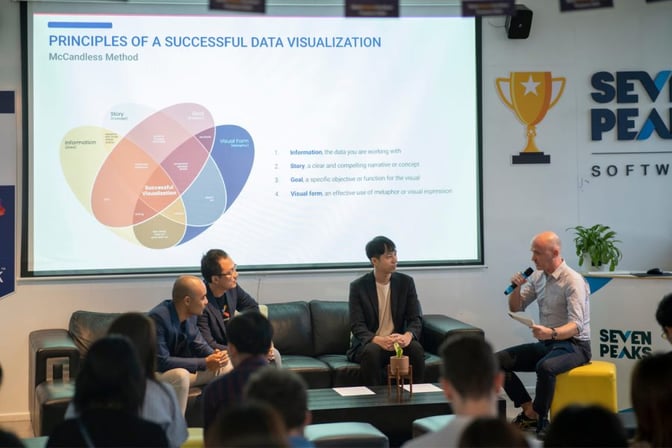
We recently hosted a special BKK WEB meetup, partnered with SCB TechX to bring a panel discussion with some of the industry’s top experts. The discussion was moderated by Damien Velly, VP of Data & Analytics at Seven Peaks, who was joined by Danai Laksameethanasan, Data Science Director of SCB TechX, Chayut Jungpanich, Senior Data Science Consultant at SCB TechX, and Yemunn Soe, Analytics Business Partner at Proximity Designs.
The right data visualization techniques can transform overwhelming amounts of data into actionable insights that drive business growth. This BKK WEB session offered a comprehensive guide to understanding and implementing data visualization.
Here are some of the key takeaways from the discussion on “Data Visualization & Storytelling for AI & Data Engineering”.
Effective data visualization and storytelling
The ultimate aim of data visualization and storytelling is to ensure your end users understand and engage with your work. Therefore, the core of data visualization and storytelling is to understand your audience, especially non-technical audiences.
Start by drawing a conclusion that will matter to your key stakeholders, and then transform this into a visualization that simplifies the data. Once you have your data visualization, incorporate it into the storyline.
When building a dashboard, your data visualization should flow based on the user’s journey through the dashboard. Start with an introductory explanation that contextualizes any graphs, charts or other visualizations, and conclude with a summary of key trends and takeaways.
Data visualization tools and techniques
The right tools can improve your data visualization, however it can be difficult to decide which to use. Smaller businesses might be able to handle small data sets on Excel. However, Excel lacks the data semantics and integrity you will eventually need, and can cause bottlenecks.
Open-source tools like R, Python and JavaScript are most commonly used, however they are designed for developers. Meanwhile, mainstream options like Power BI, Tableau, Sisense and GoodData are more interactive and accessible for non-developers, encouraging collaboration across departments.
Some BI Tools allow users with less technical expertise to pivot and interact with data. This encourages self-service business intelligence, while also enabling stakeholders to find the specific insights they need, when they need them.
Ultimately, the tools you choose will depend on an organization’s budget, your technical abilities, and how data self-sufficient you want your operations team to be.
Furthermore, the visualization technique you choose will depend on the data you are trying to represent. Scatter plots are good for finding patterns and trends from two variables, while a heatmap may be good for large amounts of data. Box plots and histograms can be good for identifying anomalies in very large data sets.
For more complex, multidimensional analysis in AI and data engineering, multivariate analysis is a better option.
Nonetheless, you should bear in mind that the best visualization helps your audience understand the outcomes and trends in no time.
Real-time data analysis: necessary or not?
Naturally, a key component of data visualization is how you manage and analyze the data itself. Real time data analytics enables immediate action, while batch analytics are typically done daily, weekly, or monthly.
The power of real-time data lies in its immediacy, but that doesn’t make it suitable for all use cases. Not all stakeholders need real-time data to make informed decisions. Sometimes, delayed analysis can reveal more about the trends and patterns in your data. The decision to use real-time data should be based on whether it’s necessary for the task, for real-time data activation for third party integrations, and on its business value.
If real-time data is crucial, several tools offer real-time data analytics at higher costs. Understand the cost model of the tools you’re using, such as Vertica, Snowflake or Databricks, and evaluate if using real-time data will generate enough income to justify its cost.
AI and data analytics
AI can be a useful tool for data analytics and data engineering, especially when it comes to expediting repetitive, mundane tasks. AI capabilities are constantly developing, especially with several sources available for people to collaboratively build and share models, such as Hugging Face.
Nevertheless, the human aspect is still needed to provide context and industry-specific knowledge to ensure that the data analytics you perform align with your business goals.
Ensuring data integrity and avoiding bias
Data visualization is a method to simplify data into a format that is easy to understand, and should not be used to manipulate data or reinforce bias. Data accuracy and validation is critical.
Data quality control can be enforced through data profiling and testing, from before the ingestion stage and all the way through the pipeline.
Data visualization buy-in from businesses
Storytelling can also help convince businesses why they need data visualizations. Business stakeholders know the primary and secondary KPI needed to run their business. Let them work with data analysts and data storytellers to ensure that the data visualization makes sense. This will help to make the best clear data story that businesses can embrace easily.
As businesses embrace data, it’s essential for users to enhance their data literacy skills, for example through data literacy courses. This understanding can improve interaction with dashboards and other data visualization tools, and can help businesses run their own analysis.
In conclusion, the key to effective data visualization lies in understanding the purpose and objectives of the data, as well as the people who will use that data.
If you’d like to watch the full panel discussion, you can watch our live recording here.
 Damien Velly, VP of Data and Analytics at Seven Peaks
Damien is a strategic innovator and digital product development leader with 8+ years of experience working in the intersection between business, technology and design. As an expert in data and analytics, Damien has developed 20+ products and services, with 15M+ USD total in documentable benefits.