Share this
by Seven Peaks on Nov 24, 2022 11:32:00 AM
DevOps is becoming a popular term for developers & IT operatives. With its increasing importance and benefits to the software development cycle, there are many DevOps tools for automation that enable teams to accelerate their innovation and improve productivity.
At the Spooky Cloud Realm meetup held on October 26, 2022, at the Seven Peaks office, we had three experts in cloud solutions provide their expertise on unique topics including the top must-know DevOps automation tools as well as useful hacks in cloud development.
Starting with Giorgio Desideri, who is the senior cloud lead and certified cloud architect for AWS and Azure, he shared his experiences about the monster of DevOps.
Then Sirinat Paphatsirinatthi, who is the Cloud Native Bangkok Community Lead, Admin of DevOps Thailand and Founder of the Bangkok HashiCorp User Group, offered some insights regarding the Hybrid Kubernetes Cluster with Azure Arc.
And our last speaker, Massimo Dradi, a senior .NET developer, provided his knowledge on usage analysis with Application Insights.
Read along to learn about the top must-know DevOps tools for automation and take your software development to the next level!
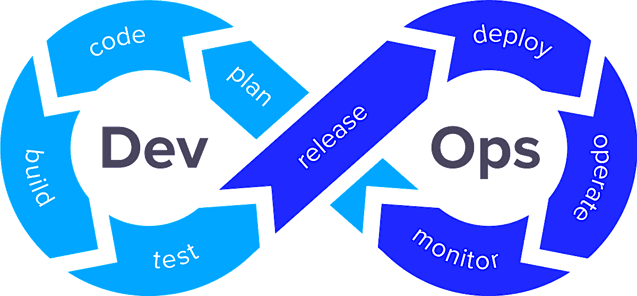
The Monster of DevOps
Giorgio Desideri, was our first speaker. He started with the spooky story of how the “DevOps monster” was born.
Many people may have heard about the roles of software development and IT operations, responsible for building software and maintaining it accordingly. However, the struggle between the two teams often arose when the code was developed, the server or cloud services were ready to receive the compiled code, but no one was able to complete the operations.
Hence the role of DevOps, a monster that bridges the gap between deployment, configuration, and maintenance, was introduced. DevOps enables faster software development and easier maintenance of existing deployment across teams.
We may refer to DevOps as the “Frankenstein monster” with its hybrid nature, not belonging to either the developers or operations teams, but being able to work with both parties and respond with a suitable solution accordingly.

X-DevOps: Extensions of the monster
The DevOps role may also include some of the following qualities:
- SecDevOps which stands for security, developers and operations. SecDevOps brings together the security team with the developers and IT operations. It aims to automate the validation processes for the project’s security requirements.
- QA: Quality assurance testing is still a crucial part of the software development cycle that enables accelerated time to market within the DevOps initiatives. It acts as a bridge between all departments from clients and business to DevOps.
- Agile: DevOps can be integrated with the agile methodology to increase the efficiency and quality of development and deployment, with their shared emphasis on quick adaptability and continuous workflow.
The Blue Monster: Azure DevOps
Azure DevOps is a suite of tools and services provided by Microsoft that enables development teams to collaborate on application planning, development, delivery, and operations. The Azure cloud platform allows enterprises to make better use of their software development life cycle than was previously possible.
Here we summarize the key benefits of the 5 most used DevOps tools for automation on Azure that may be helpful to your projects:
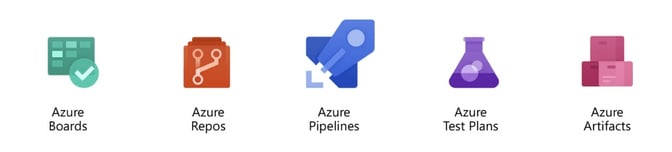
Azure Repos
Azure Repos is a set of version control tools used for managing code by tracking the version history whenever a change is made to the code.
Azure Repos provides two types of version control. The first one is Git, a distributed version control, while the second is Team Foundation Version Control (TFVC) for centralized version control. Azure Repos is also able to integrate with Azure Boards and Pipelines for seamless development cycle processes.
Azure Pipelines
Through continuous integration (CI) and continuous delivery (CD), Azure Pipelines is a tool for automating the steps of building and deploying an app.
In Azure Pipelines, the continuous integration is labeled as ‘build pipeline’ which describes an automation of the building and testing of code. Meanwhile the continuous delivery, also referred to as ‘release pipeline’, is an automation of the deployment of the application to ensure the final product is made available to the customers. To define a pipeline, you can use the YAML pipeline editor or the classic editor.
Azure Artifacts
Azure Artifacts allows developers to create, host, and share packages from public and private sources with the team by managing it all in one place. It’s easy to connect to Azure Pipelines so it can store the artifacts made by the build pipeline. Those artifacts can work with many different kinds of packages, such as NuGet, npm, Python, Maven, and Universal Packages.
Azure Test Plans
Before deploying software, Azure Test Plans offers a way to manage exploratory, planned manual, and user acceptance tests. On Test Plans, developers have a unified overview of all the test cases that need to be checked, which involves both manual and automated tests.
Manual tests can be created by specifying the steps, actions, and expected results. When a new feature is introduced, the tester can run through all of the steps accordingly.
In addition, automated tests can also be executed in the CI and CD processes in Azure Pipelines, and the test reports can be published on Test Plans.
Azure Boards
Azure Boards is a project management tool that enables planning and task management, including dashboards and progress tracking reports for everyone in the team. Azure Boards supports many types of project workflows that suit your organization, such as Agile, Scrum, Basic, and CMMI.
The Orange Monster: AWS DevOps
Next, Giorgio introduced us to the DevOps tools for automation on the AWS platform that also enable fast, secure, scalable, and high quality software development which include 4 of the following tools: CodeCommit, CodeBuild, CodePipeline, and CodeDeploy.
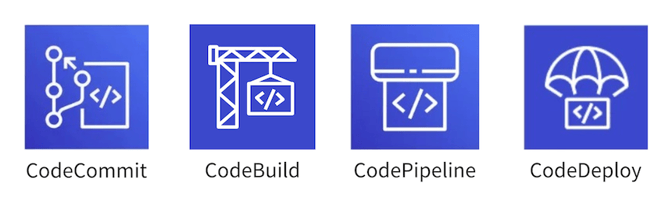
CodeCommit
CodeCommit is a source control system based on Git that is highly scalable, secure, and fully managed by AWS Cloud Services.
CodeBuild
CodeBuild is a fully managed build service that compiles source code, runs tests, and produces software packages that are ready to deploy.
CodePipeline
CodePipeline is a continuous integration and delivery service that builds, tests, and deploys your code every time a new update is made.
CodeDeploy
CodeDeploy is a tool that automates code deployments to any instance and on-premises servers. This lets you control everything from one place and reduces the amount of downtime.
The Cyan Monster: GCP DevOps
Another cloud provider to offer DevOps tools for automation is the Google Cloud Platform, which is a collection of cloud computing services from Google, running on the same infrastructure as Google’s end-user products.
The main advantages of using GCP DevOps services are access to Google’s vast ecosystem and its significant security offerings. Here is a comprehensive list of the three most commonly used GCP DevOps tools: Cloud Resource Depository, Cloud Build, and Cloud Container Registry.
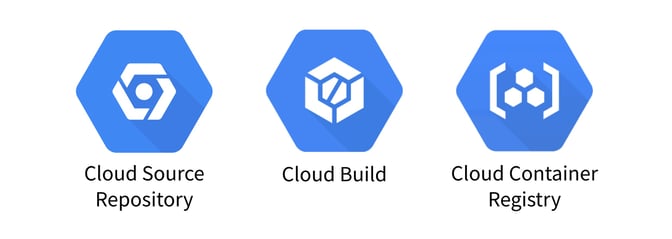
Cloud Source Repository
Cloud Source Repository are private Git repositories hosted on Google Cloud Platform that enables development and deployment of an app or service with collaboration functions and version control, ensuring fast and indexed code search across all your repositories.
Cloud Build
Cloud Build is a service that executes your builds on Google Cloud infrastructure by importing source code from various sources, including Cloud Storage, Cloud Source Repositories, GitHub, or Bitbucket, executing a build to your specifications, and producing artifacts such as Docker containers or Java archives.
Cloud Container Registry
Container Registry is a service for storing private container images, allowing your team to manage Docker images, perform vulnerability analysis, and manage access control from a single place. With the CI/CD integrations, you can also set up fully automated Docker pipelines for fast feedback.
Hybrid Kubernetes Cluster with Azure Arc
The second speaker, Sirinat Paphatsirinatthi, explained the importance of Hybrid Kubernetes Clusters and how to set up the Azure Arc enabled Kubernetes architecture with some example cases.
First of all, a Hybrid Kubernetes Cluster is an open-source container platform that combines the leverage of on-premises and cloud resources, providing consistency for application deployment, no matter the platform, that best suits business needs.
Within an organization, you may have to handle Kubernetes Clusters on different cloud providers for many projects at once, or the people on your teams may be using different platforms.
With the Azure Arc enabled Kubernetes cluster, you will be able to connect clusters running on different platforms to Azure Arc, including other public cloud providers like GCP or AWS and on-premises data centers, and govern them all from a single place. Additionally, you can also connect multiple Kubernetes clusters together and manage them under the same policy.
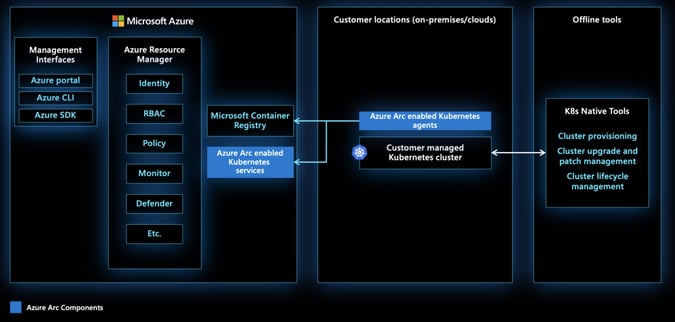
Looking at the architecture of the Azure Arc enabled Kubernetes cluster, the Kubernetes Clusters from different cloud services can be connected to Azure Arc by installing an agent which will forward all the information to Azure. Once they are connected, all the resources, including identity, RBAC, policies, monitoring, and security, can be managed from a single panel on the Azure services.
Hybrid Kubernetes Cluster: Use cases
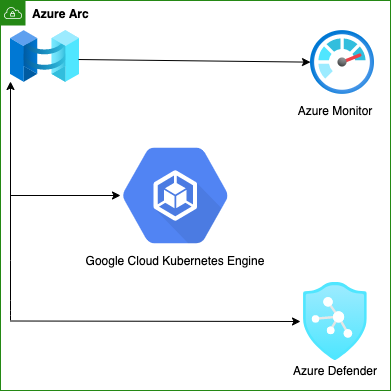
Next, as an example of the Hybrid Kubernetes Cluster use cases, Sirinat walked us through the steps of setting up the GCP clusters to connect with the Azure monitor via Azure Arc.
The first step is to go to the GCP site and choose ‘create a standard cluster’. Fill in the inputs, including cluster name, type, version, and region. Once the cluster is created, you will receive the credentials for connecting to the GCP cluster.
Next is to go to the Azure web portal and ‘add existing kubernetes clusters’. Then, fill in the cluster details. Here it is important to note that the cluster region must be the same as in GCP clusters. Last is to ‘run script’, where Azure will generate a script for connecting the clusters to the Azure Arc by copying them.
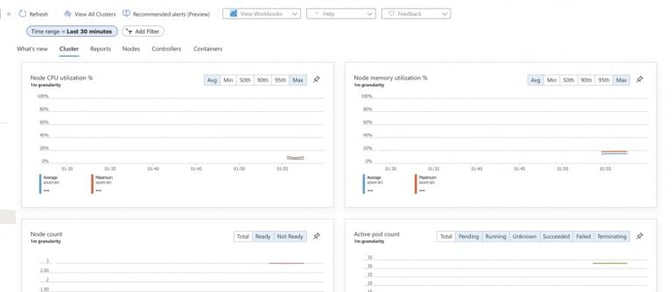
After the GCP clusters are successfully connected to the Azure Arc, a status update will be sent. You can then connect with the Azure monitor so that the GCP clusters can be monitored through the Azure portal. Additionally, the CPU, memory, Node count and Pod count for the GCP clusters can also be monitored from the same place.
Usage analysis with Application Insights
Massimo Dradi was our third and last speaker. He talked about how Azure Application Insights works and how it can help with usage analysis.
Azure Application Insights is a tool for live monitoring, logging, and performance analytics of a website or application. It is part of the Azure Monitor service. Application Insights track the performance of an application by taking two main approaches: proactively understanding how an application is performing or reactively reviewing application execution data to determine the cause of an incident.
Application Insights: Architecture
An example of the Application Insights architecture is shown in the diagram below. You have the web pages of a client’s app that sends HTTP requests to your web service. Your web service could also be linked to other services like SQL, external services, or background services through dependency calls.
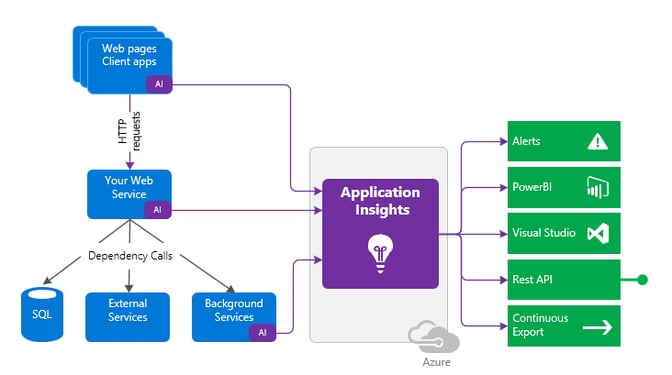
Application Insights can be set up to track the web page performance from the client side on the front-end, or it can be connected to the server side on the back-end, as well as background services.
The data collected in Application Insights can then be exported or analyzed in many different ways; for example, by creating alerts, connecting to PowerBI, Visual Studio, or Rest API.
Sending telemetry from applications
To enable performance and usage analysis of your web application, Application Insights sends telemetry from your web application to the Azure site. The best method is to install Application Insights both in your app server code and in your webpages. Then telemetry from the client and server components of your app can be sent back to the Azure portal for analysis.
Setting up requires creating an Application Insights workspace-based resource. Afterwards, you will get the instrumentation key or connection string and configure your application.
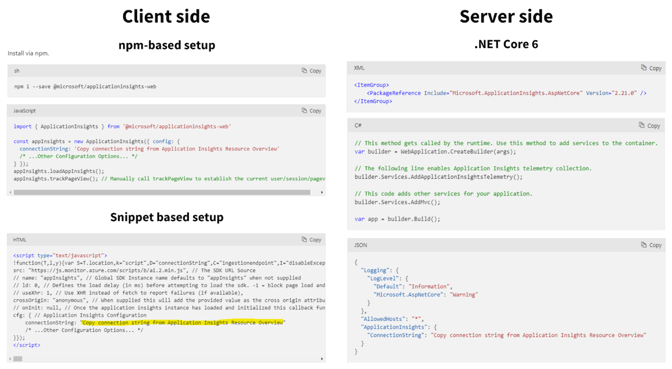
On the client side, you may incorporate Application Insights into the app in two different ways. The first approach uses NPM and allows you to set up an instance of Application Insights in your app after installing it. The other method involves using a snippet-based setup, which requires you to paste a script snippet at the beginning of every <head> tag for each page you want to monitor.
Meanwhile for the server side, you can configure your ASP.NET web app to send telemetry to Application Insights by first installing the Application Insights SDK NuGet package for ASP.NET Core. Then, add AddApplicationInsightsTelemetry() to your Startup.cs or Program.cs and configure the connection string (or Instrumentation key) in appSettings.json
Getting started with Usage Analysis
Usage analysis uses the data collected in Application Insights to help you understand how users interact with the product. In addition, it can provide you with useful knowledge to support data-driven decisions about the next development cycle. Most of the time, usage analysis is done on front-end applications.
Some of the questions that usage analysis can help you answer are:
- Which features are the most popular?
- How engaged are your users?
- Do your users achieve their goals with your app?
- Which type of users use the product most heavily/often?
- What friction points or issues are they running into?
Users, Sessions, and Events
Users, Sessions, and Events are the three different perspectives you can use to track when people use your web app, what pages they’re most interested in, where your users are located, and what browsers and operating systems they use.
The Users tool lets you know how many people have used the features of your app overall. The Users report tells you how many unique people visited your pages during the chosen time frames. In web applications, user counts are associated with anonymous IDs stored in browser cookies. A single person using different browsers or machines will be counted as more than one user.
The Sessions tool reports how many sessions of user activity have included certain pages and features of your app. A session is defined as a period of activity by a user. Unlike the users tool, the sessions report counts the number of user sessions that visit your site. A session is counted after half an hour of user inactivity, or after 24 hours of continuous use.
The Events tool, which contains custom events, requests, and page views, shows how often certain pages and features of your app are used. A page view is counted when a browser loads a page from your app or when custom events and requests are created.
Cohorts
A cohort is a set of users, sessions, or events that have something in common when you have to analyze a particular group of users or events repeatedly. It is defined by the Application Insights Query Language (AIQL). Cohorts can be saved and reused similarly to filters, but because they are built from custom analytics queries, they are much more adaptable and complicated.
User flows
The User Flows tool tells you how users navigate between the pages and features of your site through visualization. It can help you answer these questions:
- How do users leave a page on your site?
- What do users click on a page on your site?
- Where do users churn the most from your site?
- Are there instances where users repeatedly carry out the same action?
The User Flows tool starts from an initial page view, a custom event, or an exception that you define. Given this starting event, User Flows shows the events that occurred before and afterwards during user sessions. Lines of varying thickness indicate how many times each path was followed by users.
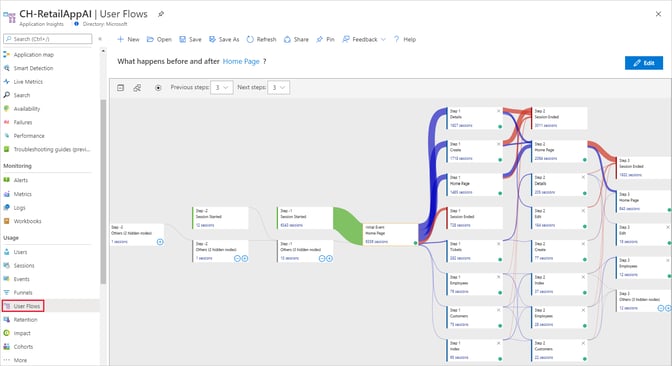
Special Session Started nodes show where the session for subsequent nodes began. Session Ended nodes illustrate the areas where users may have departed your site by displaying the amount of users who sent no page views or custom events after the preceding node.
To create a User Flow, you start by selecting an initial page view, custom event, or exception to be a starting point for the visualization. Then, select the previous and next steps.
Conclusion
There is no denying that the DevOps tools for automation offered on various cloud service platforms are going to make team collaboration and communication much easier.
In addition, the Hybrid Kubernetes Cluster on Azure Arc can centralize management and monitoring for all clusters in one place. Furthermore, Application Insights provide numerous tools to analyze user behaviors so that businesses can make data-informed decisions.
In this fast-paced IT industry, organizations that continuously switch up their processes for an innovative and efficient approach will be able to significantly improve their performance and stay ahead of their competitors for a long time.