Rafael Loh, Mixpanel’s Head of Solutions Engineering for APAC, shared insights with us on how to use Mixpanel to analyze data events from differing levels of data maturity to increase customer engagement and digital application retention.
Mixpanel’s Success with Global Brands
Mixpanel’s event analytics solution is best in class, providing full integration into the Customer Data Platform (CDP) stack. Mixpanel’s success with global brands can be seen with over 8,000 clients worldwide.
Part of Mixpanel’s innovation is its ease of use and integration with existing data stacks - we want our customers to be able to get to the data as soon as possible, without having a steep learning curve. For example, if we look at user journey analysis – a common question is, “How do we get to this point in the customer journey?” Event analytics often reveal that the most common path may not be the best path to achieve the highest conversion.

Getting Data into the Mixpanel Core
Depending on the customer’s data maturity, you can choose to connect your data with Mixpanel in the following ways:
- Track events using Software Development Kits (SDKs) and Application Protocol Interfaces (APIs)
- Connect directly through CDPs, which allow you to stream data efficiently without the need for 3rd party tools
- Import data from your data warehouse or cloud service such as Google BigQuery, AWS Redshift, Snowflake, or Databricks

Mixpanel and Seven Peaks
As an innovative and advanced technology solution, Mixpanel offers the best event analytics solution integration to a wide variety of ecosystem partners across different industries. However, given the challenging and competitive environment in Thailand, having Seven Peaks as a local implementation partner is key to our strategy. While Mixpanel can provide the tools and technology, we also need someone who fully understands the specifics of the market and the needs of our potential clients there.
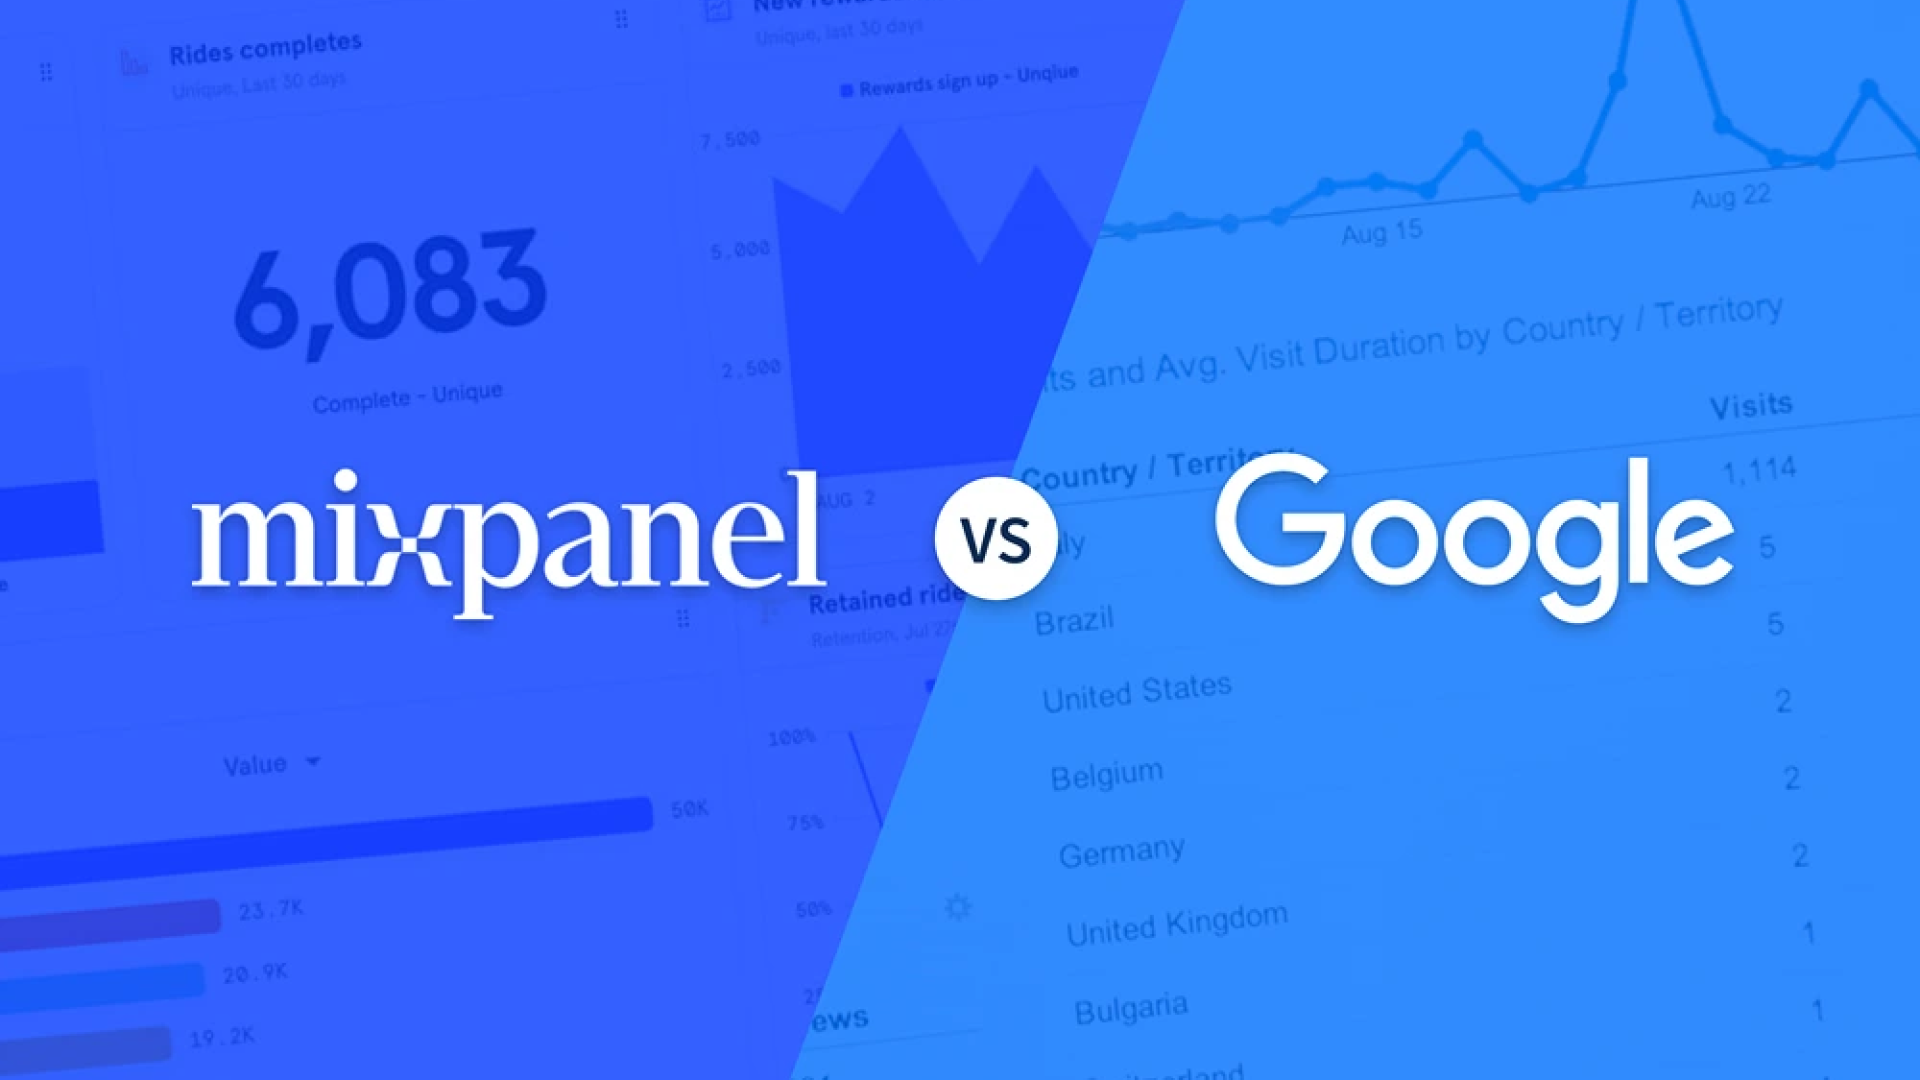
 We started our strategic partnership with Seven Peaks last year, and observed that the market maturity in Thailand is still at a very early stage. Many businesses are still using free tools like Google Analytics. The problem is that tools like Google Analytics are largely inadequate for businesses, especially large BFSI (Banking, Financial Services, Insurance) companies. For instance, Google Analytics doesn't give businesses access to real-time data – which can be business critical. If an app crashes, you wonʼt know immediately when and why it happened. This can be a serious problem for BFSI, and can result in extended downtime that does not get resolved in a timely manner. BFSI consumers have high expectations, and it’s understandable because we're talking about their money and more importantly, their time. Acquiring users in this sector can also be expensive.
Seven Peaks already understands the value of data, having helped clients with end-to-end services and analytics. With this partnership, Seven Peaks can continue to build awareness and educate the customers of the value of data using Mixpanel.
Banking, Financial Services, and Insurance (BFSI) industries in Thailand
Thailand has progressed a lot in the past five years. While businesses used to prefer all-in-one solutions, they now look at building a best-in-breed tech stack to gain access to the best tools in the market while maintaining flexibility. With a wide variety of integrations, Mixpanel sits in the heart of the best-in-breed tech stack for user and event analytics. BFSI companies can use Mixpanel to implement new KYC processes that drive better conversions, understand the user journey, and improve the overall customer experience of financial digital products.
The data maturity of each business is an important factor in deciding when different tools and technologies come into play and how different tools can work in synergy with each other, also factoring adoption and cost efficiency of the tools to reach the most optimal solution.
 For BSFIs in Thailand, most customers still implement using SDKs, followed by a hybrid of SDKs and data warehouses, and lastly, CDPs. Tracking clickstream data will still be prevalent as most businesses do not have an internal tracking system.
A major concern for BFSI customers is the use of Personally Identifiable Information (PII) in external tools. The good news is that many banking customers have their own internal user IDs other than PII to identify a user. In some cases, using a data warehouse might be a good way to integrate data as it gives customers better control over what they can and want to send to external tools.
Looking forward into the future, we can see that browsers are slowly reducing cookie tracking. At present, although we are seeing the removal of 3rd party cookie tracking by browsers, Mixpanel is not affected since we use 1st party cookie tracking. However, ad blockers will still affect data accuracy. For customers who want to future-proof this, a good method to ensure better data accuracy will be to use server-side tracking, such as server-side SDKs, and using the data warehouse as the source of truth.
Building an internal tracking system, or tracking by proxy, polishes the client’s own servers so they can get the data into their own systems and monitor everything from a dashboard that product managers, business, and marketing team members across the organization can utilize.

“We help the world learn from its data.”
Mixpanel empowers everyone to get the answers they need to take meaningful actions.
Digital businesses innovate faster by measuring, analyzing, and improving their product experiences. Gather deeper insights about your product so you can build, measure, and learn quicker than ever, and give people at all technical levels the ability to receive self-serve answers about customer behavior. Make data-informed decisions all while getting to understand why users convert, engage, and retain, so you can make product improvements that they love. Discover which feature releases, experiments, and engagement campaigns truly moved your metrics.

"Mixpanel is an event analytics platform that allows you to track how users interact with your product, website, mobile app, or any other internet connected device."
Mixpanel has a powerful end-to-end stack, which can be divided into the following main layers:
- Data Infrastructure
- Data Governance
- Behavioral Analysis
- Data Monitoring
Data Infrastructure

The main component of Data Infrastructure is Data Pipelines, which allow you to export your cleaned, backfilled, and transformed data to the data warehouse of your choice – such as Redshift, Big Query, Azure, or Snowflake – so you can run ad-hoc analyses with the tools you select, and use our fully-managed pipeline to send data to your desired destination. Examples of blob storage providers include Amazon S3, Google Cloud Storage (GCS), and Azure Data Lake Storage. Mixpanel will clean, transform and backfill your data for you, so that it is compliant with data regulations like GDPR, and is always up to date.
The second component of Data Infrastructure is Warehouse Connectors, which allows you to natively import data from Snowflake, BigQuery, Redshift, & Databricks into Mixpanel. With this feature, you can set up recurring syncs from your data warehouse and ensure that Mixpanel is always in sync with your trusted data.
The final component of Data Infrastructure is called ID Merge, which will give you a complete picture of each user session by enabling you to match post-login data and behavior retroactively with pre-login events and their respective unique user ID across multiple devices using a common user ID.
Data Governance
Lexicon is our data dictionary in Mixpanel, and is where you can add and manage descriptions for all events and properties to organize your data. Lexicon allows everyone in your organization to trust the data, understand what it means, and build accurate reports based on that data. You can also fix mislabeled trackers without having to change any code.
Permissions allow you to accurately manage which employees are able to access what data, on both the individual and team levels.
Live View, or “Events” allows you to QA your data as it goes into your event stream, offering developers a real-time view into the health and performance of implementations and seeing if the events being tracked are flowing into Mixpanel correctly.
Behavioral Analysis
Mixpanel provides powerful ways to analyze and visualize your metrics and KPIs, user events, and revenue data. It also provides the most flexible way to segment your customers using behavioral data. Our data model allows you to run powerful behavioral queries in seconds, and we also provide the ability to help you get closer to “the why” behind the trends and insights that you gain. Complex analysis is done completely on the fly in Mixpanel.
Core Reports in Mixpanel helps you deeply analyze user behavior with out-of-the-box reports.
Insights Report helps you to segment your data by time, browser, device, or any other property, and lets you visualize and compare your data so you know where to analyze further.
Funnels allow you to monitor and improve conversion rates by pinpointing exactly where your users drop off, enabling you to identify opportunities and make data-driven decisions that have immediate impact.
Flows enable you to optimize the user experience by identifying the most common paths and user journeys that are taken to arrive at an action, what leads them away from that action, and also what users do after performing that action. A basic example of this is comparing the usage patterns of returning users against new users to spot where they get stuck in the user interface.
The final core report is Retention, which uncovers valuable information about which users keep coming back, and the effect of adding new features or improvements to your digital product.
For in-depth analysis in Mixpanel, there is Cohort Analysis, which allows you to group users by particular properties or if they have performed a set of events. The key is to understand how different groups of users behave and to target groups that matter most to you in terms of retention, churn, and more, to drive them to the optimal set of actions.
Signals allow you to discover what behaviors lead to a specific goal or outcome, helping you to find user behaviors that correlate to higher retention – it quickly examines your events and recommends actions that will have the greatest impact on your metrics.
Impact shows PMs if their newly added features are making a difference, and compares the behaviors of those who have used a feature versus the ones who have not.
Experiments show how each A/B test variant you import from external ab testing tools impacts your metrics, and show how each of your tests and investments are directly impacting the metrics that you care most about.

All of these reports at your disposal result in fast and limitless segmentation, which coupled with Mixpanel’s data model allows our customers to handle and manipulate their data in any way they wish, putting the focus on things that matter the most.
Metrics Monitoring

Dashboards allow you to share progress on key metrics in several ways, notifying you and your team whenever certain goals or changes are attained.
Find Interesting Segments uses machine learning to analyze what the top conversion drivers are in each segment, and uses event properties and cohorts to reveal statistically significant segment data that convert higher or lower than average.
Lastly, you can use Custom Alerts to notify you when there are important movements in your metrics – such as sudden drops or spikes in your KPIs – to make sure that nothing is ever missed and that your team is on top of everything happening with your digital product as it happens.
Mixpanel Enables 360o Analytics

Mixpanel gives you data-fueled events analytics tools. If there are any data points from your digital product with the customer, our platform is able to span across all the potential touch points so our customers can not only ask the right questions, but also get the answers that matter most.
A CDP should be able to collect data from software, but then also stream all this data to various downstream platforms. CDPs are a way to collect data from the real usage of your customers, thereby making it the source of truth – then it sends it all to Mixpanel for advanced event analytics. 360o analytics takes data from all touchpoints – Customer Relationship Management (CRM) systems, retail and e-commerce, insurance, and even customer support tickets – giving you data on what, when, and why:
- New users are dropping off
- Behaviors differ between custom cohorts, such as returning users vs. new
- Features and new implementations impact your metrics, so you know exactly what to invest in to improve retention

Rafael Loh
Head of Solutions Engineering at Mixpanel
Rafael works with businesses to help them get deeper insights into how users are interacting with their product and to build their better customer engagement. At Mixpanel, he leads a dynamic team of Solution Engineers to drive the adoption of Mixpanel’s solutions among leading apps and websites in the APAC region.